Production & maintenance
On the way to MTU Green Global
Climate action at the production sites
We are realigning our energy management to permanently reduce our use of fossil fuels and emission of greenhouse gases in production and maintenance. More green energy and CO2 avoidance are key here. In the long term, MTU aims to achieve climate neutrality in its site operations. As of 2045, we want all the Group’s production sites to be carbon neutral for Scope 1 and 2.
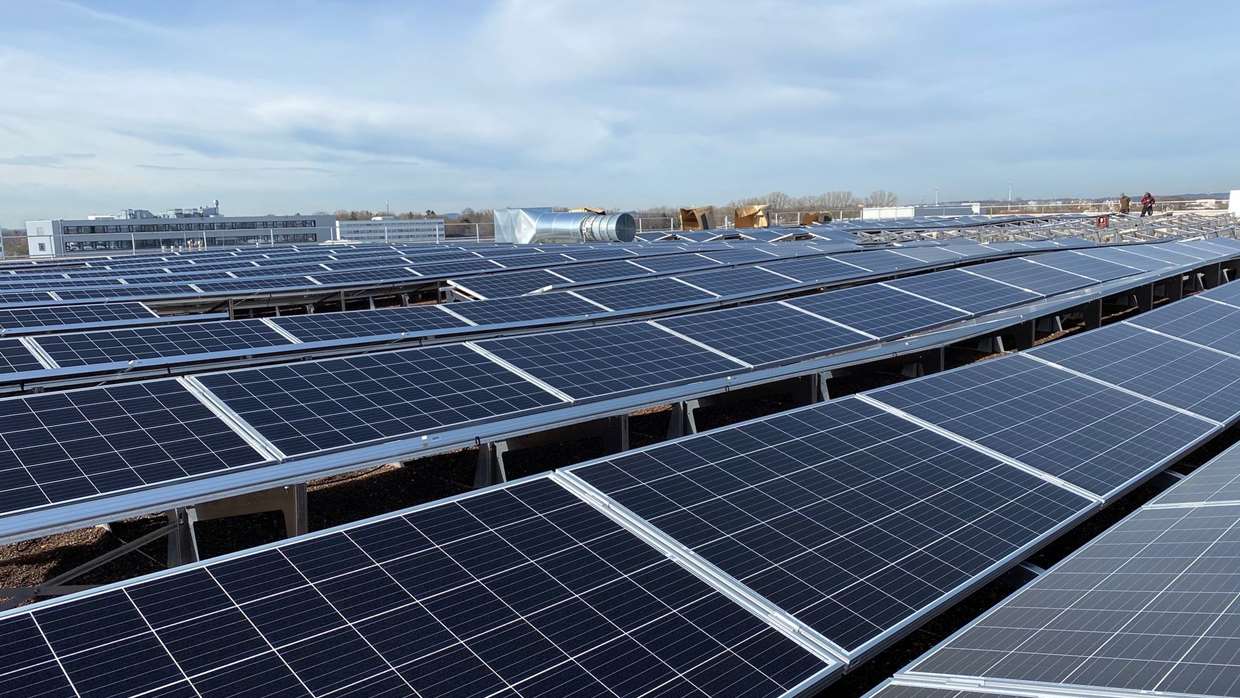
MTU’s own green electricity production via photovoltaic systems in Munich and Rzeszów heralds the transformation toward green energy.


MTU aims to continuously reduce the greenhouse gas emissions resulting from manufacturing and maintenance work at its facilities as a contribution to global climate action in line with the objectives of the Paris Agreement. In 2021, MTU launched its ecoRoadmap climate action strategy for its headquarters in Munich. The following year, this strategy was expanded to all European production sites (Munich, Hannover, Ludwigsfelde, Rzeszów) under the banner of MTU Green Europe. Green Europe aims to reduce MTU’s carbon footprint by 60% by 2030. This effort will involve sustainable measures, the expansion of our own emissions-free power generation and the increased use of green energy (measured in terms of significant emissions from Scope 1 and 2, base year: 2019). We compensate for any unavoidable CO2 emissions that arise through operations at the Munich site by means of high-quality offsets, such that we have been able to operate this location on a climate-neutral basis since 2021. The integration of the production sites in Canada and Serbia (in operation since 2022) into the climate strategy starts in 2023. Langfristig strebt die MTU Klimaneutralität im Standortbetrieb an. In the long term, MTU aims to achieve climate neutrality in its site operations. By 2045, we want all the Group’s production sites to be carbon neutral for Scope 1 and 2 without offsetting.
Fast Facts: #GreenMTU
CO2 emissions of the production sites to be significantly reduced by 2030 (base year 2019).

We want to cover our heating needs at the Munich site mainly by using thermal water from the ground.
MTU’s electricity consumption already comes mainly from renewable sources.
More green energy for MTU
Our climate action experts are developing sustainable measures for the Green Europe locations and are implementing them together with the departments. These measures include replacing equipment with low energy efficiency, systematically fixing compressed-air leaks and better insulation through roof greening and renovation. MTU’s own green electricity production via photovoltaic systems in Munich and Rzeszów heralds the transformation toward green energy. The emission factor for electricity used at the locations in Hannover and Munich has improved compared to previous years. At the Poland site, electricity consumption is completely emissions-free for the second year in a row. More than 75% of the company’s total electricity consumption already comes from renewable sources. For the Munich site, MTU continues to advance deep geothermal energy, having carried out exploratory drilling on the site in 2022. By using thermal water from the ground to supply heat, the site could become largely independent of fossil fuels starting in late 2024.

In addition, the production sites have been implementing local environmental programs that predate the ecoRoadmap. The Hannover site has, for example, focused on implementing measures to reduce gas and electricity consumption in machinery and building management. The Eco Facility 2025 project at the location in Rzeszów, Poland, aims to reduce environmental impacts and to promote environmentally conscious behavior among the workforce: improvements in media and material consumption as well as in the amount of waste generated are expressed in terms of CO2 to raise awareness.
When it comes to climate action at its sites, MTU also counts on its employees’ ideas and participation. As part of an eco-ideation challenge in 2021, employees submitted concepts for low-emission site operations in Munich. The resulting ideas are both pursued in the departments (e.g. in logistics) in a decentralized manner and developed further in a centralized manner (e.g. for heat neutrality).
Employees plant trees at the Forest Day
At MTU’s first Forest Day in Dietramszell, Bavaria, apprentices and employees planted larches and spruces. After a walk through the trees guided by the forest ranger, the MTU crew lent a hand to the gradual conversion of the wooded area from pure stand to mixed forest.
Energy consumption in 2022
CO2 emissions in production and maintenance (Scope 1 and 2) essentially result from the energy consumption required for site operations. Regarding non-renewable primary energy, we use natural gas and the aviation fuel kerosene as well as fuels for mobility, which make up a very small proportion of the total. In Munich, we generate electricity and heat using a cogeneration plant (BHKW), which is much more efficient and emits less pollution than a conventional power plant. We intend to use more photovoltaic energy in the future, and we have commissioned our first photovoltaic systems at the Munich and Rzeszów sites. In addition, the Hannover site makes use of solar energy with the aid of a solar thermal power plant and also employs a cogeneration plant comprising three micro gas turbines for generating electricity and heat. What’s more, a new heat pump for combined heating and cooling went into operation in 2022. We also achieve greater energy efficiency by having the sites use waste heat from compressed air generation as thermal energy (combination principle).
The total energy requirement for Scope 1 and 2 was 306.7 gigawatt-hours (GWh) in 2022, which is lower than in the previous year (331.3 GWh). This goes to show the success of our energy-saving measures, both in terms of our climate strategy and as a result of the requirements stipulated in the Energy Security of Supply Ordinance, which became effective in Germany in 2022. Our energy demand for Scope 1 (direct energy consumption) was also lower than in the previous year. Scope 1 primarily concerns the energy sources natural gas and kerosene. Natural gas is used primarily for heating, in production and, to a lesser extent, for test stand operation. Kerosene is used as a fuel for testing engines on the test stand, so consumption depends on how extensive the tests are, the number of test runs and on engine size. MTU has no direct influence on the type and duration of test runs. All newly maintained or manufactured engines must complete a test run prior to delivery for safety reasons and to demonstrate their performance. The use of simulations in development and manufacturing reduces the amount of development testing for new engines. We are able to run our test stands in Hannover on sustainable aviation fuels (SAFs), and in 2022 we carried out initial test runs of customer engines with alternative aviation fuels at MTU Maintenance.

In 2022, we procured a total of 136.0 GWh (2021: 130.1 GWh) of external energy (Scope 2). This increase is largely due to the Munich site’s higher electricity consumption caused by a failure of the cogeneration plant that lasted some time. Electricity is a major energy source for us. It accounts for 42.2% of our total energy consumption (externally sourced electricity only). This electricity is drawn from renewable sources in varying proportions. At the site in Poland, for example, it was completely emissions-free. MTU Maintenance Canada gets a large portion of its electricity from hydroelectric power stations, which are a renewable resource. As part of our ecoRoadmap, in the future we aim to successively increase the purchase of green electricity generated exclusively from renewable sources.
|
Energy consumption Scope 1 and 2 (in GWh) GRI 302-1 |
|||
|
|
2022 |
2021 |
2020 |
|
Total |
306.7 |
331.3 |
307.5 |
|
Direct energy consumption, natural gas, kerosene, mobility = Scope 1 |
170.7 |
201.2 |
191.5 |
|
Indirect energy consumption, electricity, district heating = Scope 2 |
136.0 |
130.1 |
116.0 |
The energy consumption of fuels for mobility excludes the site in Canada. Energy consumption other than that shown in the table (e.g. other fuels) is not reported, as its contribution to total Group consumption is immaterial. Energy consumption from externally outsourced test runs of engines and industrial gas turbines is not included. We have corrected the calorific value for natural gas, resulting in an adjusted presentation of energy data for previous years compared to previously reported values.
Electromobility at MTU
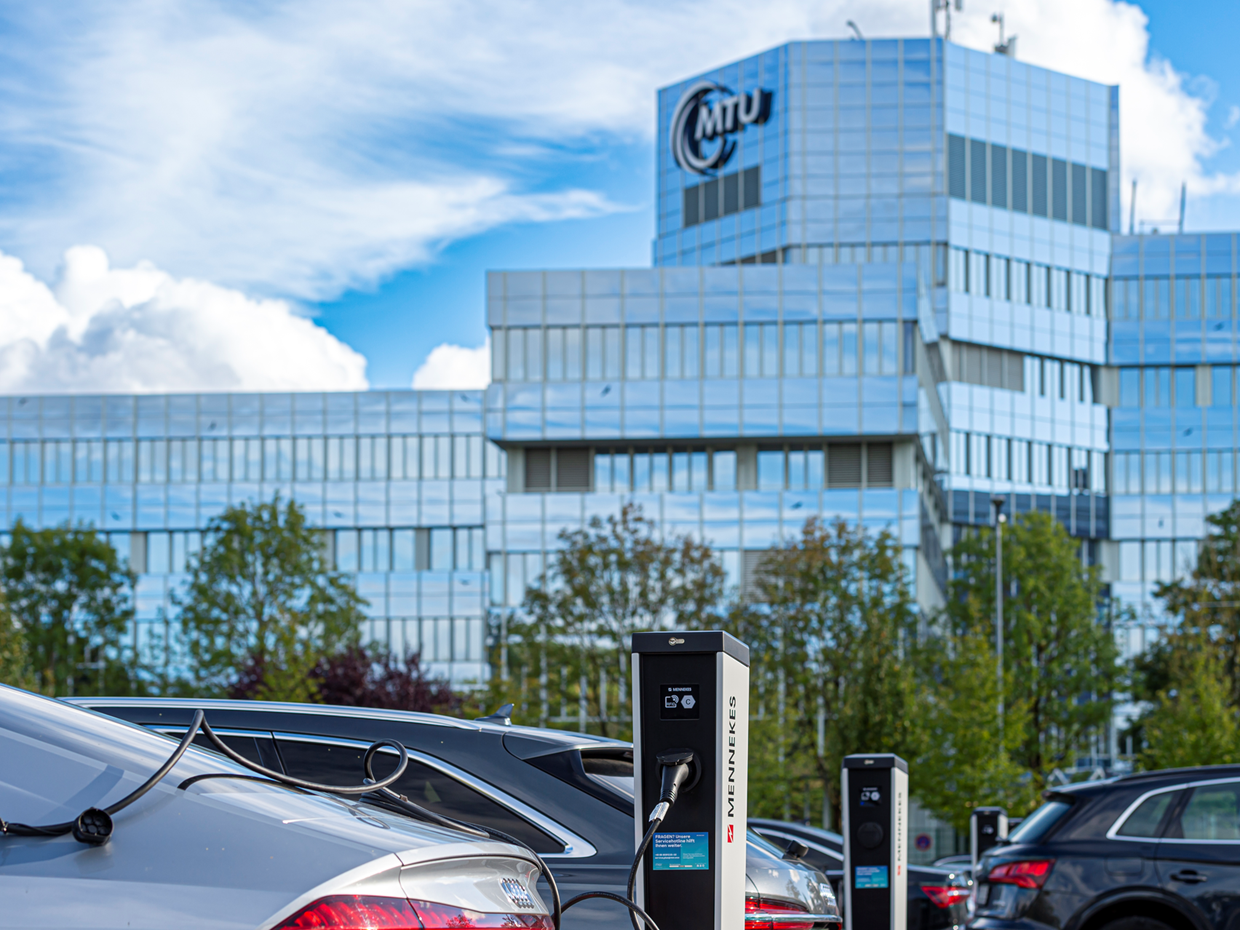
Fleet and company cars: In Germany, we have a total of 31 all-electric and 44 plug-in hybrid vehicles in use, representing 40% of the whole fleet. We expect to be able to increase this proportion to around 47% in 2023. A further increase continues to be dependent on delivery conditions. In addition, we have installed 20 regular charging stations, including eight in employee parking lots. We are planning to further expand charging capacity as demand grows.
Job tickets: We promote sustainable commuting practices among our workforce, through a special discounted “job ticket” for the local public transportation network or web portals for carpooling.
Our carbon footprint for 2022
In the reporting year, MTU generated 47,600 metric tons of CO2e emissions at its production sites throughout the Group from its use of major energy sources (2021: 54,800 metric tons). This means we achieved a reduction of 13% compared to the previous year and a decrease in CO2 emissions for both Scope 1 and 2. We were able to bring about these reductions primarily through our climate strategy.
|
CO 2 emissions (in t CO 2 equivalents) Scope 1 and 2 GRI 305-1, 305-2 |
|||
|
|
2022 |
2021 |
2020 |
|
Total |
47,600 |
54,800 |
83,200 |
|
Scope 1 |
38,000 |
44,400 |
42,200 |
|
Scope 2 |
9,600 |
10,400 |
41,000 |
MTU’s Scope 1 CO2e emissions result from consumption of the direct energy sources kerosene, natural gas and fuels for mobility. Meanwhile, MTU’s Scope 2 CO2e emissions result from the consumption of bought-in energy (electricity and district heating). The calculation of Scope 2 emissions uses emission factors from energy suppliers (market-based method). Other sources of CO2e such as refrigerants or other fuels are not reported as their contribution to Group emissions is immaterial. Consumption in Canada is included, but without mobility data. CO2e resulting from externally outsourced engine and industrial gas turbine test runs and the combustion of sustainable aviation fuels during engine test runs in Hannover is not included in the balance sheet. We have corrected the calorific value for natural gas and the emissions factor for electricity at Rzeszów site (conversion to market-based), resulting in an adjusted presentation of emissions data for previous years compared to previously reported values.
MTU compensated the remaining Scope 1 and 2 CO2e emissions for operations at Munich by means of high-quality offsets, such that this site achieved net-zero status in 2022.
CO2 reduction is an important ESG goal
Due to the high priority of climate action at MTU, the reduction of carbon emissions is an important environmental, social and governance (ESG) goal. CO2 is an ESG-relevant KPI that factors into the variable compensation of the Executive Board and senior managers. Our goal attainment is based on the Europe-wide climate action strategy for emissions generated by the European production sites (Munich, Hannover, Ludwigsfelde and Rzeszów). It is measured in terms of residual CO2 emissions as “maximum residual CO2 emissions” (based on current emission factors) and in terms of “CO2 savings through sustainable measures” (based on 2019 emission factors) compared to the base year 2019. A twelve-month period that deviates from the reporting year is considered the performance period for this purpose (Dec. 1, 2021 to Nov. 30, 2022). At 44,000 metric tons of CO2, the result was below the target value of 54,000 metric tons due to systematic CO2 reduction and the purchase of green electricity. The savings target for sustainable measures was also reached (2,000 metric tons; target value: 1,750 metric tons).

To make our company’s climate impact still more transparent, we take part in the annual assessment by the international non-profit organization CDP, which collects data on companies’ greenhouse gas emissions, climate risks and climate strategies on an annual basis. For 2022, we achieved a rating of B on a scale from D- to A+.
First Scope 3 carbon footprint in preparation
CO2 emissions that do not result from energy use in site operations on MTU’s part fall under Scope 3. This includes upstream value creation (suppliers), downstream product use and employees’ commute to and from MTU. The plan to determine the Scope 3 carbon footprint is now part of our sustainability strategy. We aim to record and evaluate significant upstream and downstream activities and to establish an appropriate management system at the fully consolidated sites. Scope 3 emissions from business travel in the Notes
MTU’s reforestation projects


This is how much CO2 storage we have already created through reforestation in domestic forests. (As of April 2022)
In addition to our high-quality offsets for residual emissions at the Munich site, we run reforestation projects together with our partner Deutim to create a regional CO2 reservoir. The Forest Day for MTU employees is also part of this voluntary commitment. We will pursue reforestation in Bavaria together with Deutim until 2025 and thus create climate-stable mixed forests for future generations.
The following reforestation projects have already been realized:

